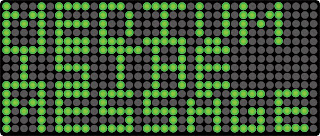
Our Tools
Thursday, April 26, 2012
The 'Net Web
As a designer, my main goal is facilitating communication. In order to do this well, I need to be concerned with how a user interacts with and experiences my designs. User experience, especially as related to interfaces, therefore, became the focus of this final project.
My project, The ‘Net Web, was inspired by Professor Souther’s word association web. Starting with a basic concept word—experience—I created an intricate association web, which allows the user to choose a word, see its connections to other words with one degree of separation, and then choose one of those words.
The project is incomplete, in large part because I have chosen to work with very basic HTML and CSS capabilities for this, the first iteration of this project. I would very much like to enhance the interaction—and the user experience—when refining this project in the future. It is also the first design in which I have deliberately sought ambiguity, rather than clarity, in the user experience.
Sources coming soon.Expanding Ideas
Body, Art and Media
Wednesday, April 25, 2012
For my project I choose to use animation. The topic of my project is Justice. Everyone deserves justice so I thought animated images with the Black and White flashing background which represents justice. Images from Trayvon Martin marches represents and shows the affection people have towards getting justice. I change the levels in the opacity to change the color tone for the figure that looks like the liberty scale. In first image I played around and thought I messed up to get object to move.
Tuesday, April 24, 2012
Generative Art with Shapes
AddingClone
BoundaryProject
BoundaryProjectVibrant
Sources:
Fry, Ben, and Casey Reas. "Processing.org." Processing. http://processing.org/ (accessed April 23, 2012).
Berchek, Chad. "Elastic Collisions Using Vectors instead of Trigonometry." Vobarian Software Home. http://www.vobarian.com/collisions/ (accessed April 23, 2012)
Greenberg, Ira. Processing: Creative Coding and Computational Art. Berkeley, California: Apress, 2007.
Shiffman, Daniel. Learning Processing. Burlington, MA: Morgan Kaufmann Publishers, 2008.
Aware of the Viewer
After making my first cinemagraph, which is of me continuously scrolling through an iPad, I had this strange feeling watching myself in an endless loop. Even when I was not on viewing the page, there is a possibility that someone could be, and the mere fact that it is out on the internet means that it could be on any website and being viewed by anyone at this very moment. A gif of me sitting on a couch captured in this moment of time for the world to see. Like I already said, being aware of this can only be described as strange. With this feeling in mind I wanted other people to experience it, however I could not very well make a gif of everyone that was interested or even everyone in the class. So I came up with the idea that the subject would become aware of the viewer. When the viewer first glances, these images just look like still photographs, but when the image is scrolled over the subject becomes aware that someone is watching and looks at them. Then when the viewer clicks their mouse, they can interact with the subject. This might be a simple blink of the eyes or a drag of a cigarette. Once the viewer is done and scrolls off the image, the subject returns to it initial position. The result of this is a mesmerizing experience with the subject. A connection as if the viewer is looking face-to-face with the subject, and the subject is aware of the viewer presence.
Work Cited
http://www.youtube.com/watch?v=mAf6zKRb1wI
http://www.eai.org/title.htm?id=1957
http://content.photojojo.com/tutorials/how-to-make-cinemagraphs-photos-that-move/
http://www.reddit.com/r/cinemagraphs/
http://tumultco.com/hype/
Vectorized Imaging
 |
| Dot Matix Illustration: Simple design made using the Dot Matrix Method |
 |
| The Grunge or Splatter Method: Used for backgrounds and texture imaging |
 |
| Line Tracing: Silhouette Method. Made from three images. Shows one of my passions (hunting). I like how this one is hard to decipher at a distance. |
 |
| Painting Text Method: I wanted to see how to make text follow a path. In this picture I turned text into a symbol into Illustrator and I could place a serious of text on any drawn path. |
 |
| Same Grunge image above seen in Picasa Photo Viewer |
 |
| Same Silhouette image above seen in Picasa Photo Viewer |
Wikipedia, "Vector Graphics." Accessed April 20, 2012. http://en.wikipedia.org/wiki/Vector_art.
Hamm, Michael. Adobe, "Painting Text." Last modified May 21, 2012. Accessed April 20, 2012. http://www.adobe.com/cfusion/exchange/index.cfm?
Harris, Jack, and Steven Withrow. Vector Graphics and Illustration: A Master Class in Digital Image-Making. RotoVision, 2008.
McLuhan, Marshall. The Medium is the Massage. Toronto: Simon & Schuster, 1989.
Psychedelic Surrealism
For this project I wanted to focus on psychedelic artwork. I used images from photos from music festivals across the country because these places are most often associated with this type of artwork. The images I created focus on altered perceptions of these locations. It is a blend of realistic and surreal images that shows the world as slightly altered instead of completely psychedelic.
The psychedelic imagery was created using a print-making technique called marbling which is made using watercolors. The watercolors are swirled with a tool to create a pattern in a tub of water. A piece of paper is then put onto the top of the water where it picks up all the paint. I took pictures of the marbling that I did, then added more color and filters in Photoshop to create a more psychedelic looking image. Then I combined those images with the photos from different festivals.
Self reflection is important. Looking back through time to see what things mattered and how well those things/goals were accomplished is something I set out to do with this series. Background colors taken from important pictures from life. A faded snapshot of mom and daughter comes more to life in full opacity to depict arrival, or at least almost arrival to where I'd like to be. Funny how over time, some things gain more importance and some things remain the same. Not entirely sure this is a happy or sad self reflection, but time keeps moving on.
Demystifying Technology


My final project was inspired by the idea of demystifying technology. In this class, we have learned to use several different pieces of software. Something that interests me in addition to becoming a proficient user of technology is studying how this software works and interacts with the computer hardware to create a finished work for the user. Unfortunately, visualizing how a piece of software such as Premiere or Photoshop works is not that simple and would therefore be a bad example to display how technology can be demystified. A great example of demystifying technology was when we did our circuit bending experiments. We were not expected to know how exactly these toys worked, but the instant the plastic cases were opened, we learned at least something about the function of the circuitry for that toy and became that much closer to understanding how it works. Neuroscience is another example of demystifying one of the most complicated technologies that exists, the human brain. By studying how the brain works and demystifying it, these scientists are gathering more and more information that could open doors to build technology in the future such as computers that may operate in ways modeled after our brains. Another technology I believe most people take for granted is what lies behind the screens we use every day to be productive while using computers or to consume media through as well. I thought it was interesting to create an animation that seems to magnify and go behind the screen to show a diagram I found online. It is a simplified representation of how the liquid crystals are controlled by electrons in order to filter a backlight which produces the colors and light intensity we see on our modern screens.
Sources:
"Circuit bending." Wikipedia. http://en.wikipedia.org/wiki/Circuit_bending (accessed April 23, 2012).
"Human Brain Region Functions Like Digital Computer." Science Daily. http://www.sciencedaily.com/releases/2006/10/061005222628.htm (accessed April 23, 2012).
Tyson, Jeff, and Carmen Carmack. "How Computer Monitors Work." HowStuffWorks. http://computer.howstuffworks.com/monitor5.htm (accessed April 23, 2012).
Final Project

I sometimes figure out when something happened in my life around when it happened in reference to a concert. When did I dye my hair red? Oh well it was definitely after the Coheed and Cambria concert but before the Them Crooked Vultures concert.I used pictures I took myself as much as possible and if I didn't have a picture from the concert I used a picture of the venue.In doing this project I realized I want to take more pictures. I have the memories of the events which are very important to me but I wish I had the physical pictures to show and share with my children someday.
This last one was kind of just for fun. I saw a data visualization on a specific species of fish (click here) and I thought it would be interesting to see what a similar visualization would look like for me.
Here are the resources I used:
Friedman, Vitaly. “Data Visualization: Modern Approaches.” 2 August 2007. 19 April 2012.
http://www.smashingmagazine.com/2007/08/02/data-visualization- modern-approaches/
“How to Draw Circle in with No Fill in Photoshop.” YouTube. 23 April 2012.
http://www.youtube.com/watch?v=EK07W73lm7Y
“Totoaba.” Visual.ly. 19 April 2012. http://visual.ly/tototaba
Evolution
Process from K Wilson on Vimeo.
The process of art can be art in its own right. If the goal of art is to create an experience or an emotion, that must also apply to the experience and emotion that is involved in getting from the idea to the final work. My goal with this project was to demonstrate the micro patterns, lines, and tone which evolve to become the larger work. The experience of evolution can speak louder than the final product.
DiMattia, Nicco. "Speed Paintings by Nico Di Mattia." Accessed April 24, 2012. http://www.youtube.com/playlist?list=PL513FEC4F07BB8C5D&feature=plcp.
Massachusetts Museum of Contemporary Art. "Sol LeWitt: A Wall Drawing Retrospective." Accessed April 24, 2012. http://www.massmoca.org/lewitt/.
Solomon R. Guggenheim Foundation. "Process Art." Accessed April 24, 2012. http://www.guggenheim.org/new-york/collections/collection-online/show-full/movement/?search=Process%20art.
I310 Final Project Submission: Objectivity/Subjectivity Storyboard
Code Cube (only works in chrome, firefox and safari)
                                    .face {color:#ffffff;overflow:hidden;position:absolute;
                                    width:200px;height:200px;}@-moz-keyframes scroll {0% {top:-800px;}
                                    100% {top:0px;}}@-webkit-keyframes scroll {0% {top:-800px;}100%
                                    {top:0px;}}.scroller {font-size:1.2em;-moz-animation: scroll 25s;
                                    -moz-animation-iteration-count:infinite;-moz-animation-timing-function:linear;
                                    -webkit-animation: scroll 25s;-webkit-animation-iteration-count:infinite;
                                    -webkit-animation-timing-function:linear;position:absolute;}.cube1
                                    {z-index:1;position:absolute;top:0px;left:35px;}.top {top:0;left:89px;
                                    background: #ababbc;opacity:0.7;-moz-transform: rotate(-45deg) skew(15deg, 15deg);
                                    -webkit-transform: rotate(-45deg) skew(15deg, 15deg);}.left {top: 155px;
                                    left: 0;background: #454456;opacity:0.7;-moz-transform: rotate(15deg) skew(15deg, 15deg);
                                    -webkit-transform: rotate(15deg) skew(15deg, 15deg);}.right {top: 155px;
                                    left: 178px;background: #787789;opacity:0.7;-moz-transform: rotate(-15deg) skew(-15deg, -15deg);
                                    -webkit-transform: rotate(-15deg) skew(-15deg, -15deg);}
When I saw cool animations done using CSS3, I was amazed by how it worked. It looked like magic to me and like any magic trick, I wanted to reveal the secrets behind it. My goal is to create something so mystifying that it will have the viewer guessing how it works. I want to give the viewer the feeling of wanting to demystify something. Web designers and experts don't like revealing their magic tricks, so when I went to find out how this works, I was only finding bits and pieces of sample code. It was as if I was searching through a dark room with a flashlight and every now and then I could catch a glimpse of what I was looking for. The code cube reflects my experience of discovery. Written on the sides are samples of the code, but not all of it. The code cube was constructed using pure CSS3 with HTML div tags. That means no JavaScript was used to animate the cube.
1. Daniel Albas, Cheryl Albas, "Modern Magic: The Case of Examination", The Sociological Quarterly, Vol. 30, No. 4 (Winter, 1989), pp. 603-613
2. Richard P. Gabriel, Kevin J. Sullivan, "Better Science Through Art", Dream Songs. January 6, 2012. <http://dreamsongs.com/Files/BetterScienceThroughArt.pdf> (04/18/12): pp. 7-9
3. Adam Sheridan, "Demystifying HTML5 & CSS3," Specialmoves Labs. April 2, 2012. <http://specialmoves.com/labs/demystifying-html5-css3> (04/18/12)
Repurpose/Reuse

Recycle

Reuse tree as Mulch

Reuse Bucket

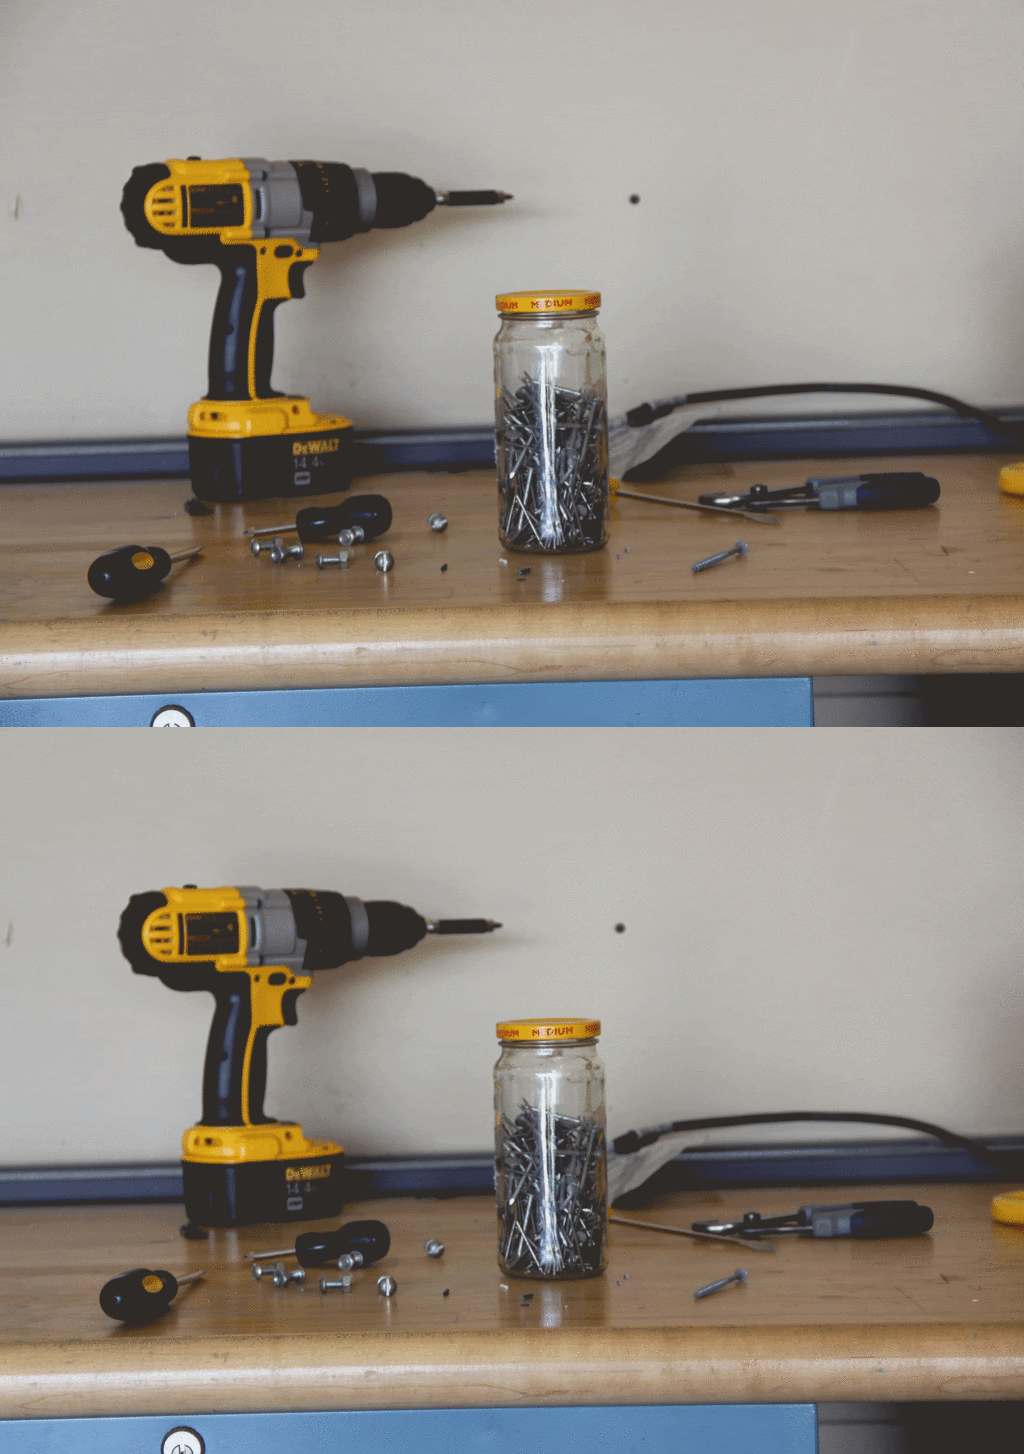
Reuse Jar for nails
Final Project - Data Visualization
Monday, April 23, 2012
I am the prop master for a local boy scout group and we do a haunted walk every year (not the last two though). My idea was to use the woods and one of the many costumes we have to create a Sasquatch video that might be able to be used the next time we advertise for the haunted walk. I used the disappearing technique that we used in class for the video. I did further research on the disappearing technique and the habits of Sasquatch. I did the voice and filming (I am not a good actor!) and my son played the part of Sasquatch in a Blair Witch-isk type of film. Bibliography included in comments in post.
Untitled from Debbie McMillen on Vimeo.
Sunday, April 22, 2012
Stickies By Design
Bibliography
Erb, Margaret B. and Dallenbach, Karl M. “Subjective Colors From Line-Patterns.” The American Journal of Psychology 52, no. 2 (April, 1939): 227-241. Accessed April 20, 2012. http://www.jstor.org/stable/1416109.
Gomariz, Emilio. “Folder Type.” Vimeo (2012): Accessed April 20, 2012. http://vimeo.com/5265672.
Kadesch, R. R. “Classification of One-Color and Two-Color Rosette Patterns.” Leonardo 31 no. 2 (1998): 125-132. Accessed April 20, 2012. http://www.jstor.org/stable/1576515.
My Flower Garden
- "PHP: Introduction - Manual." PHP: Hypertext Preprocessor. http://us3.php.net/manual/en/intro.image.php (accessed April 22, 2012).
-
"PHP: Introduction - Manual." PHP: Hypertext Preprocessor. http://us3.php.net/manual/en/intro.image.php (accessed April 22, 2012).
- Whitlock, ron. "trigonometry - Image distortion with sine/cosine - Stack Overflow." Stack Overflow. http://stackoverflow.com/questions/3552239/image-distortion-with-sine-cosine (accessed April 22, 2012).
- "Lasa Talkz...!: PHP Image Class." Lasa Talkz...!. http://lasa-talkz.blogspot.com/2011/02/php-image-class.html (accessed April 22, 2012).


