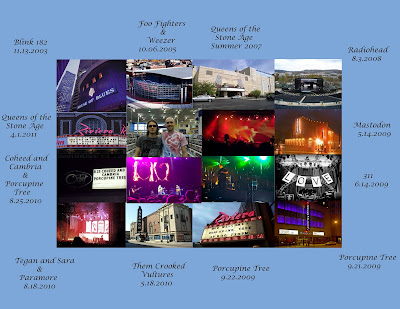
I sometimes figure out when something happened in my life around when it happened in reference to a concert. When did I dye my hair red? Oh well it was definitely after the Coheed and Cambria concert but before the Them Crooked Vultures concert.I used pictures I took myself as much as possible and if I didn't have a picture from the concert I used a picture of the venue.In doing this project I realized I want to take more pictures. I have the memories of the events which are very important to me but I wish I had the physical pictures to show and share with my children someday.
This last one was kind of just for fun. I saw a data visualization on a specific species of fish (click here) and I thought it would be interesting to see what a similar visualization would look like for me.
Here are the resources I used:
Friedman, Vitaly. “Data Visualization: Modern Approaches.” 2 August 2007. 19 April 2012.
http://www.smashingmagazine.com/2007/08/02/data-visualization- modern-approaches/
“How to Draw Circle in with No Fill in Photoshop.” YouTube. 23 April 2012.
http://www.youtube.com/watch?v=EK07W73lm7Y
“Totoaba.” Visual.ly. 19 April 2012. http://visual.ly/tototaba


No comments:
Post a Comment